Currently, I am analyzing a malware payload that employs various techniques to evade detection and hinder analysis.
1. Initial Assessment
The initial file is unusually large, weighing in at approximately 91MB. Upon inspection, the last ~90.99MB of the file consists entirely of junk data. This data is not referenced anywhere in the code and is solely appended to inflate the file size. This is a common technique used to bypass sandboxes and hinder analysis tools, as many have strict file size limits. The junk data follows a specific pattern: 55 xx xx xx xx.
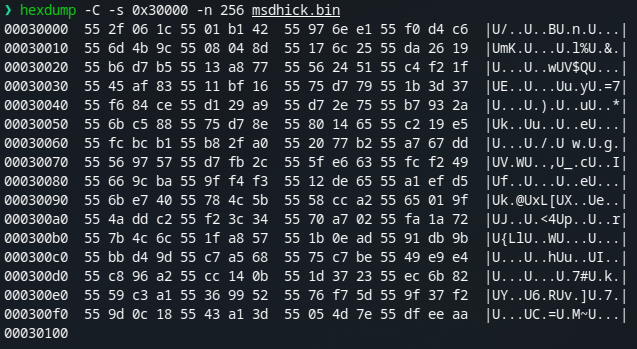
Previously, I’ve encountered malware that pads files with null bytes (0x00), which is easier to identify. However, this 55 xx xx xx pattern requires a bit more time to confirm it’s not crucial code or data.
After stripping away this junk data, we are left with a much smaller executable file, which is only about 16 KB.
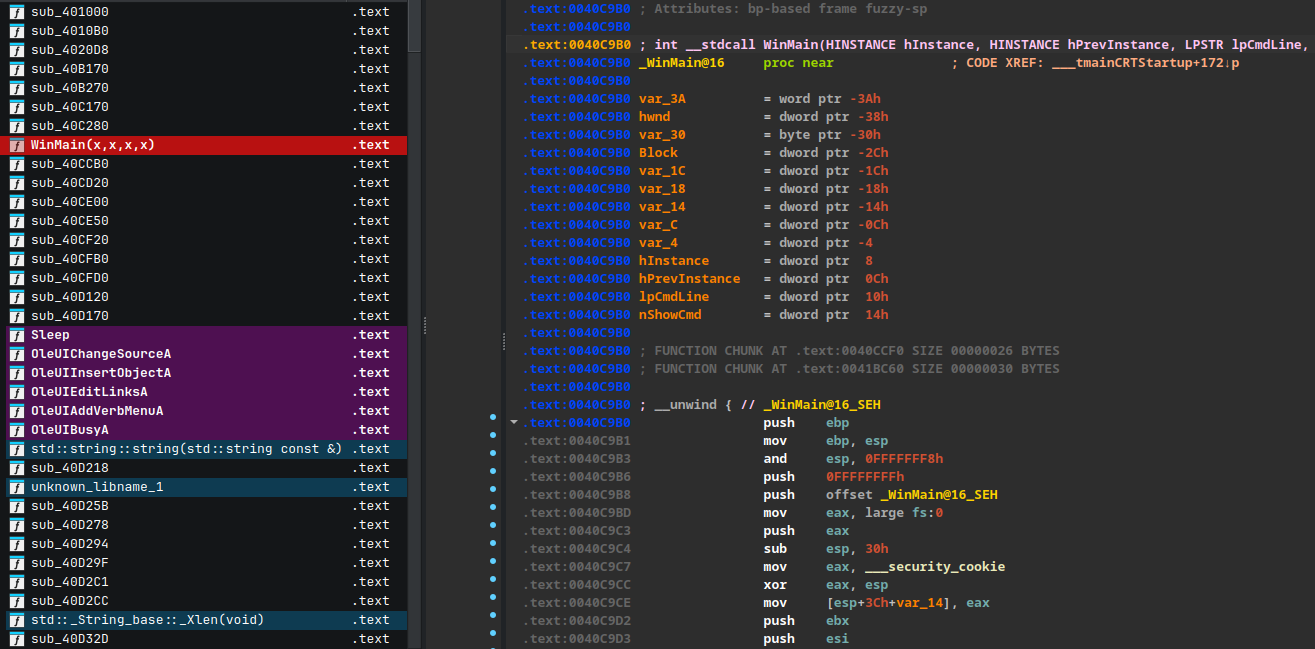
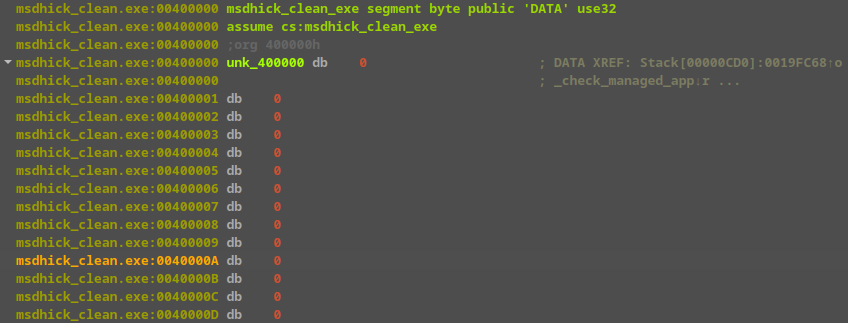
At first glance, the clean executable appears somewhat normal, but a closer look reveals some suspicious elements. There are several functions performing unusual transformations.
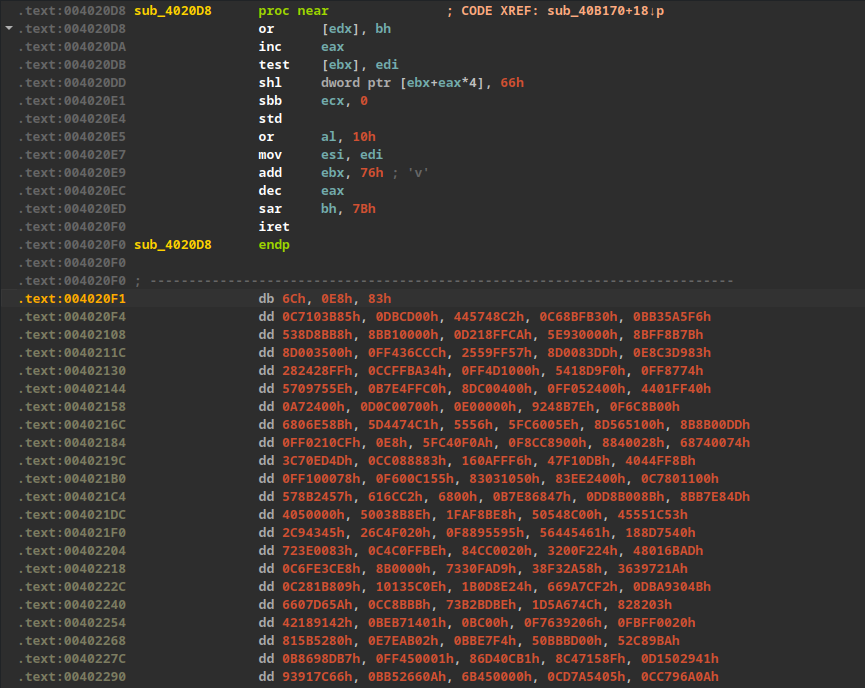
Most notably, there is a data segment within the .text section that IDA fails to recognize as valid code.
2. Dynamic Analysis & Unpacking
To understand what this unreadable code does, dynamic analysis is necessary.
Tracing the execution flow: WinMain -> sub_40C280 -> sub_40B270.
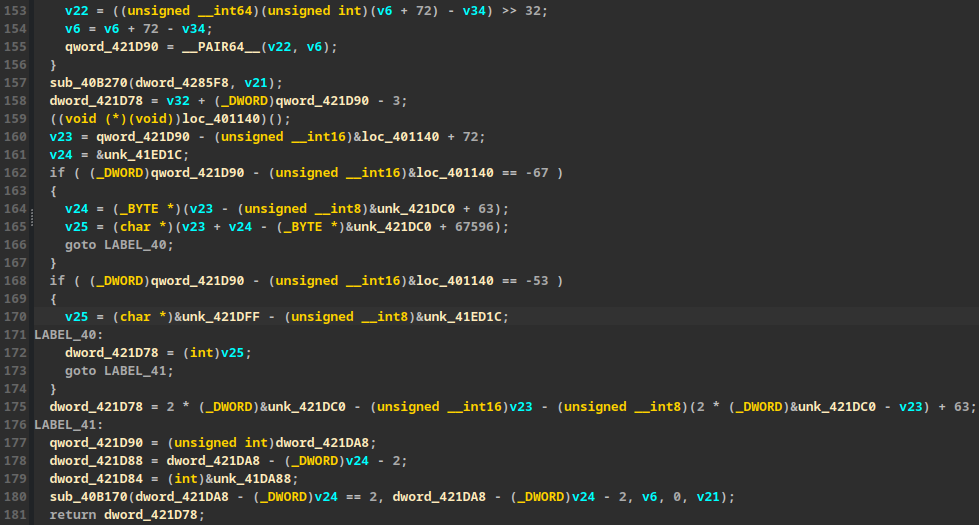
The program goes through a series of chaotic calculations designed to decrypt data and introduce a sleep delay to evade sandbox analysis.
Interestingly, when reaching the ret instruction in sub_40B270, the execution does not return to the caller. Instead, it jumps to another block of code, loc_423160, located in the .data section.
After some debugging, it becomes apparent that the malware resolves Windows APIs dynamically via the Process Environment Block (PEB).
For example, it calls VirtualAlloc:
.data:00423700 push    esi
.data:00423701 push    ecx
.data:00423702 push    40h ; '@'
.data:00423704 push    3000h
.data:00423709 push    ecx
.data:0042370A push    0
.data:0042370C call    [ebp+var_14] ; -> kernel32@VirtualAlloc
The execution flow is quite convoluted, jumping around frequently. However, tracing reveals a pattern: resolve API -> decrypt code -> jump to it -> continue.
The traditional approach here is to monitor memory allocation functions like VirtualAlloc and VirtualProtect. Setting breakpoints on these APIs allows us to observe how the malware manipulates its data.
After allocating memory, the malware writes data into it—this could be code, data, or an entire PE image.
Eventually, it calls VirtualProtect on its own image base and then clears it.
Immediately after, it copies a new PE image into the space.
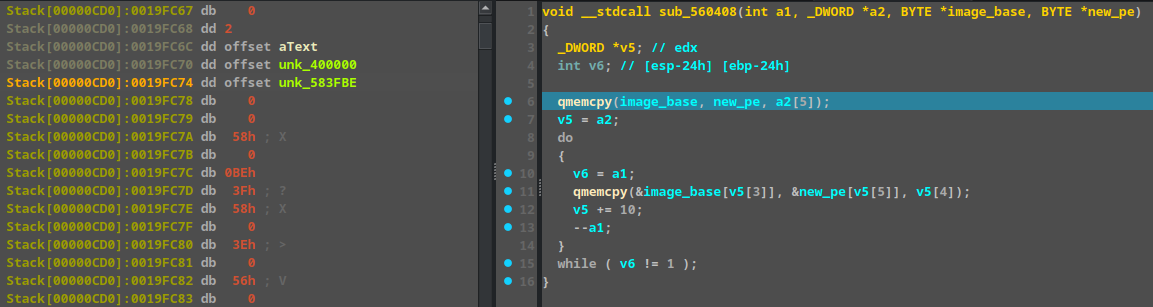
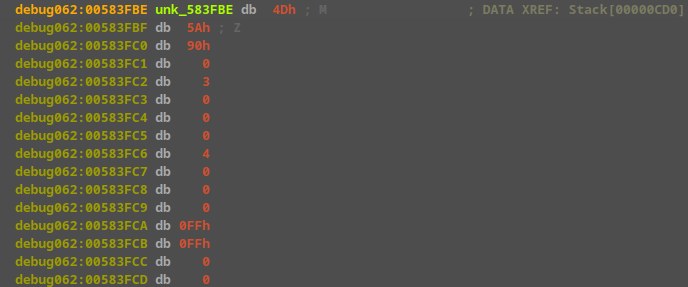
unk_583FBE contains the new PE.
To summarize the unpacking process: the PE decrypts its own code -> jumps to it -> allocates new code -> jumps to it -> allocates a code region for a new PE -> decrypts data into it -> overwrites the old PE -> calls VirtualProtect to restore section permissions -> jumps back to the PE (which is now the newly decrypted code).
At this stage, we can dump the newly loaded PE from memory.
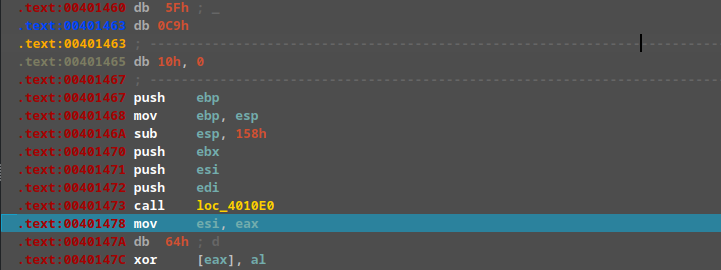
The program then returns to the .text section. The old PE’s role is finished, and we can now load the newly dumped PE into IDA for further analysis.
3. Analyzing the Second Stage Payload
The dumped PE is not overly complex.
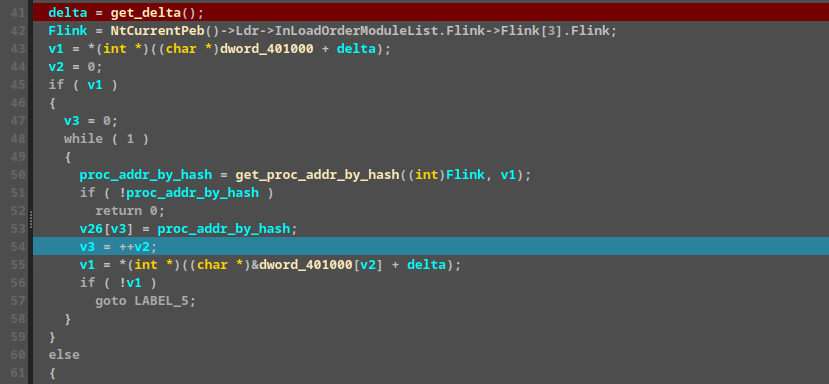
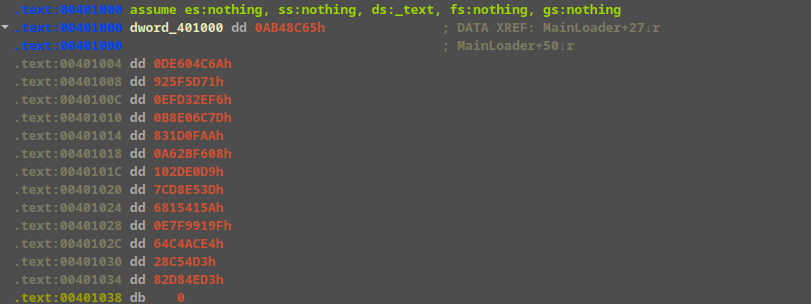
It still resolves APIs dynamically, this time relying on hashes stored at dword_401000, which are then saved into v26.
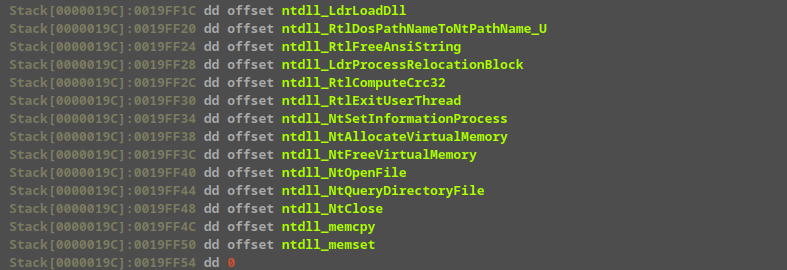
Here are the APIs after they have been resolved:
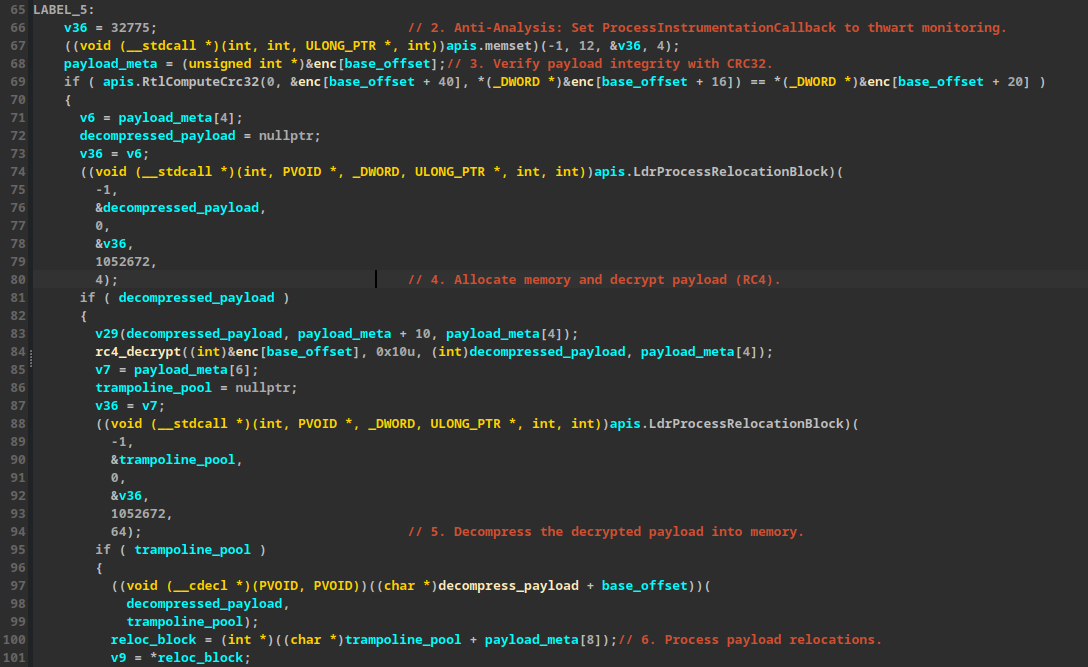
The data at unk_40200 is decrypted using RC4 and subsequently decompressed.
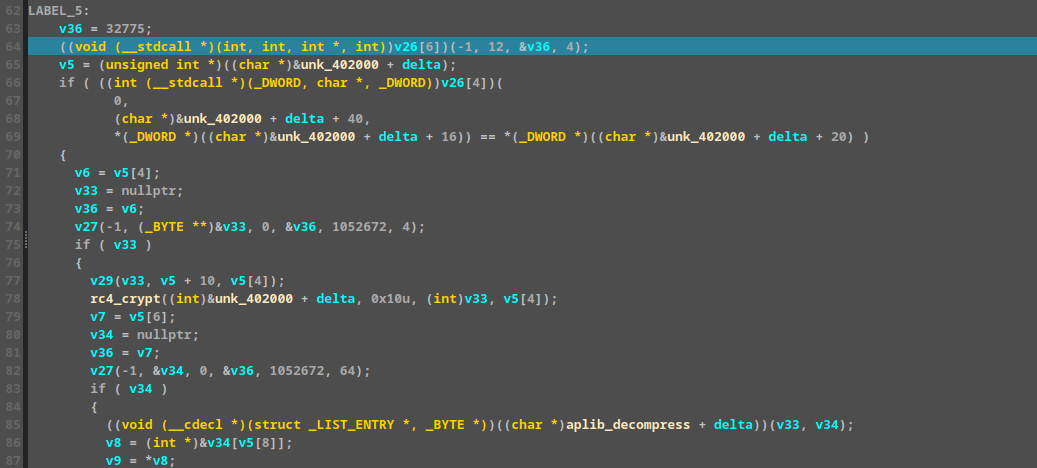
Renaming and setting the correct types for these variables makes the code much clearer.
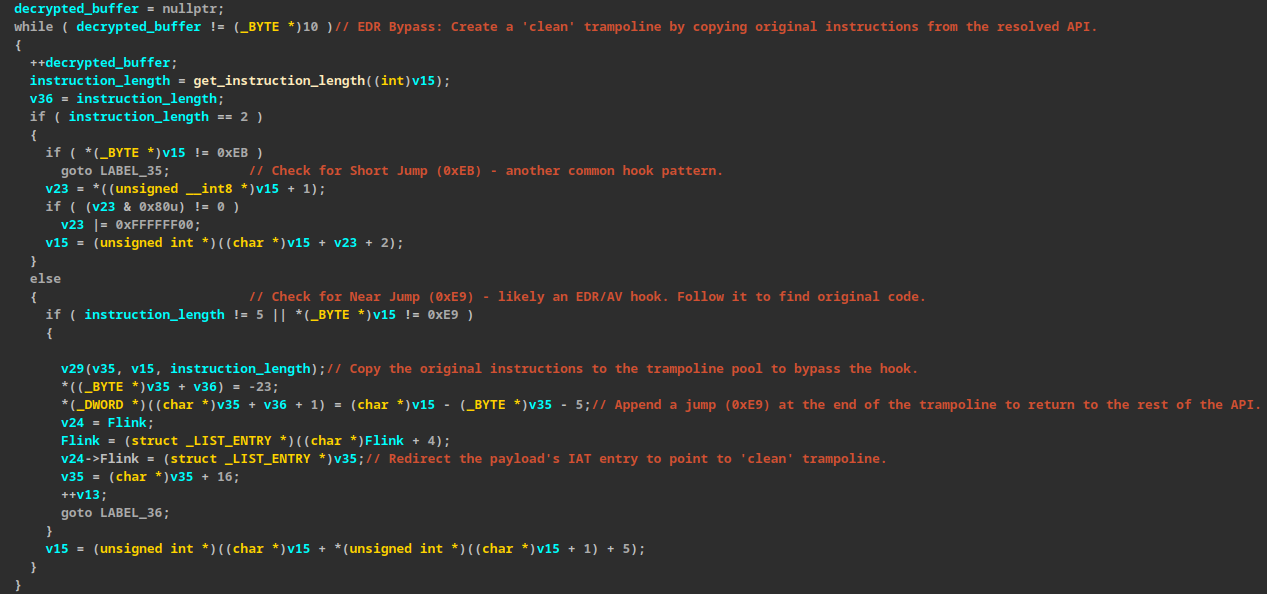
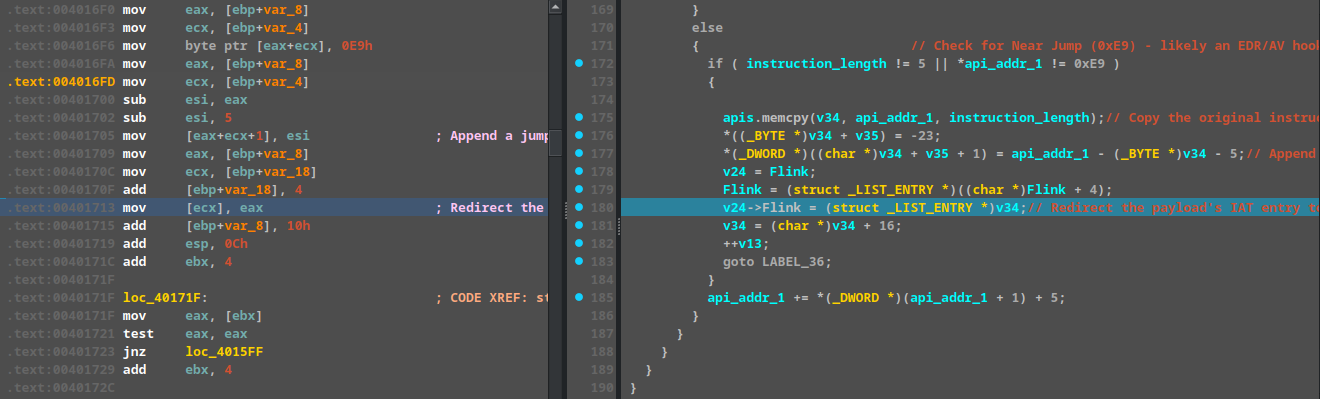
EDR Hook Bypassing
After resolving an API, the malware does not call it directly. Instead, it creates a “trampoline” to bypass potential EDR hooks. The malware calls this trampoline, which in turn calls the original API.
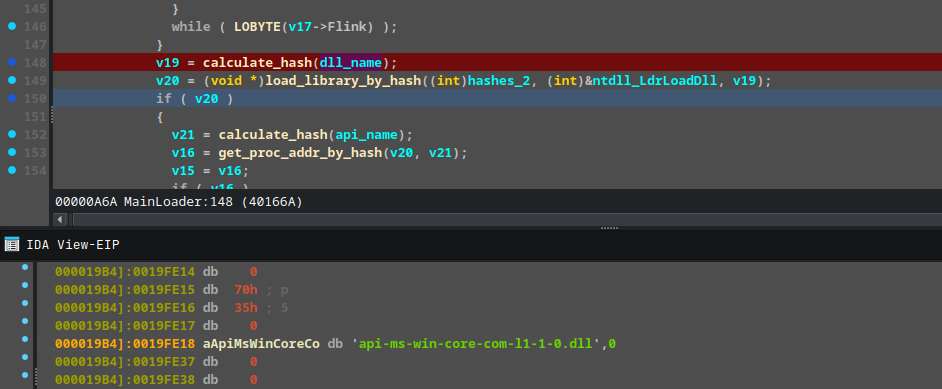
During debugging, the malware unexpectedly terminated. Tracing the crash revealed that it was attempting to load api-ms-win-core-com-l1-1-0.dll via a manual, exact-name file scan rather than using the standard Windows API loader. On modern Windows 10/11 systems, api-ms-win-* identifiers are not physical files on disk; they are API Sets (virtual DLLs) that the OS automatically redirects to real binaries like combase.dll. Because the malware bypassed the OS translation layer and looked for a physical file that does not exist, the lookup failed.
Patching the requested string in memory to combase.dll forced the malware to target the correct physical binary, resolving the dependency error and allowing execution to continue.
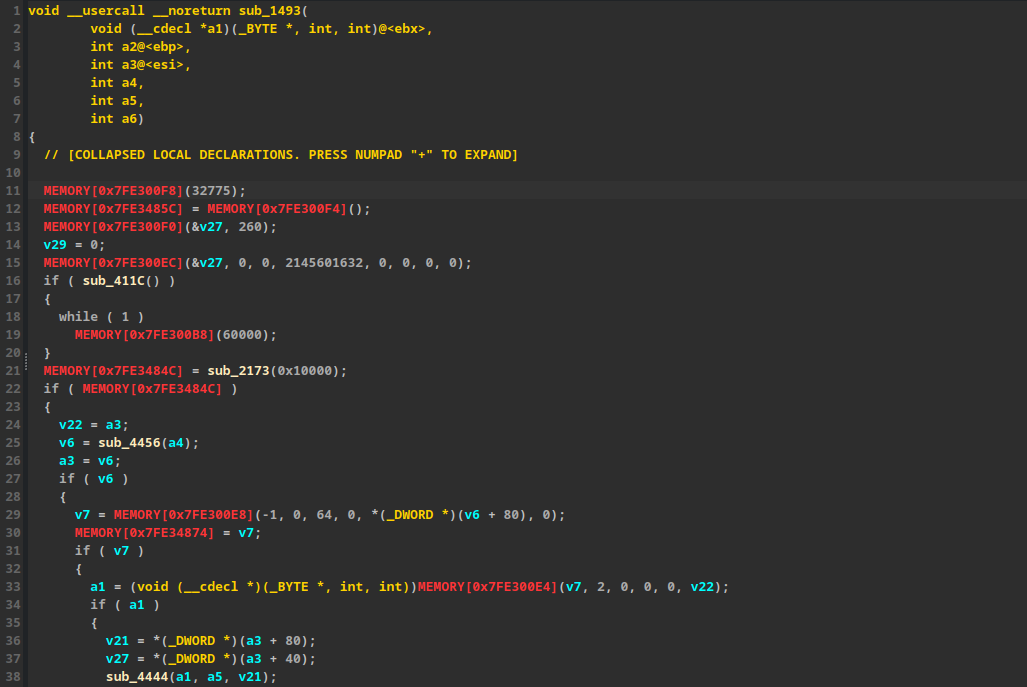
4. Final Payload & API Recovery
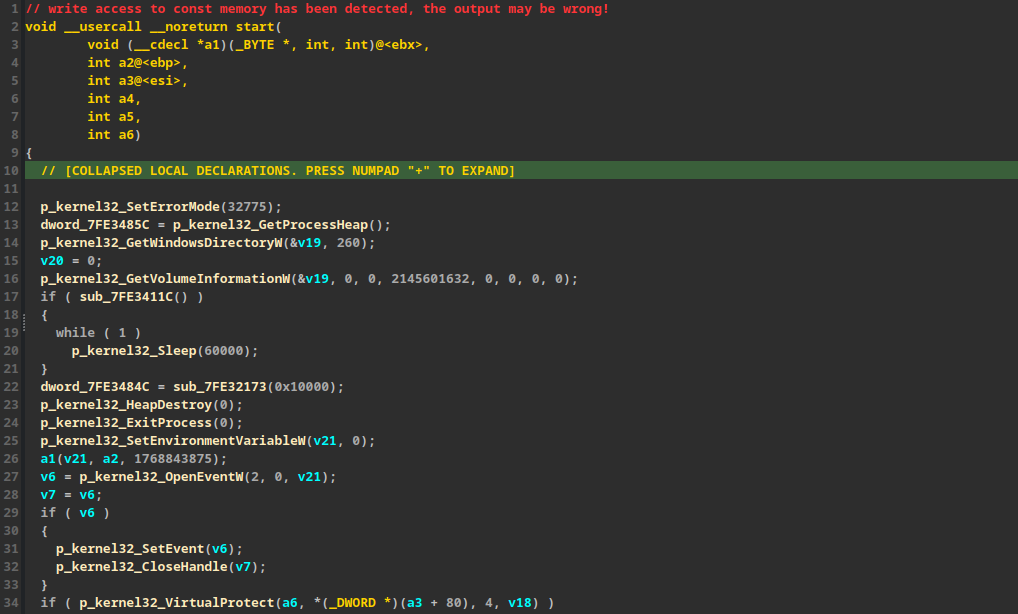
Once all APIs are resolved, the execution finally reaches the core payload, starting at this function:
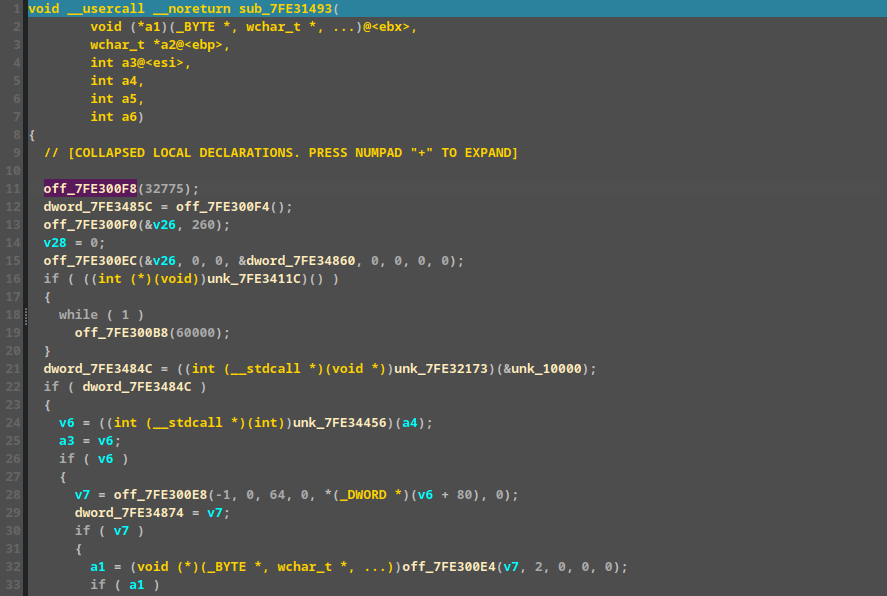
There are numerous direct function calls using memory addresses, which are the result of the prior API resolution process.
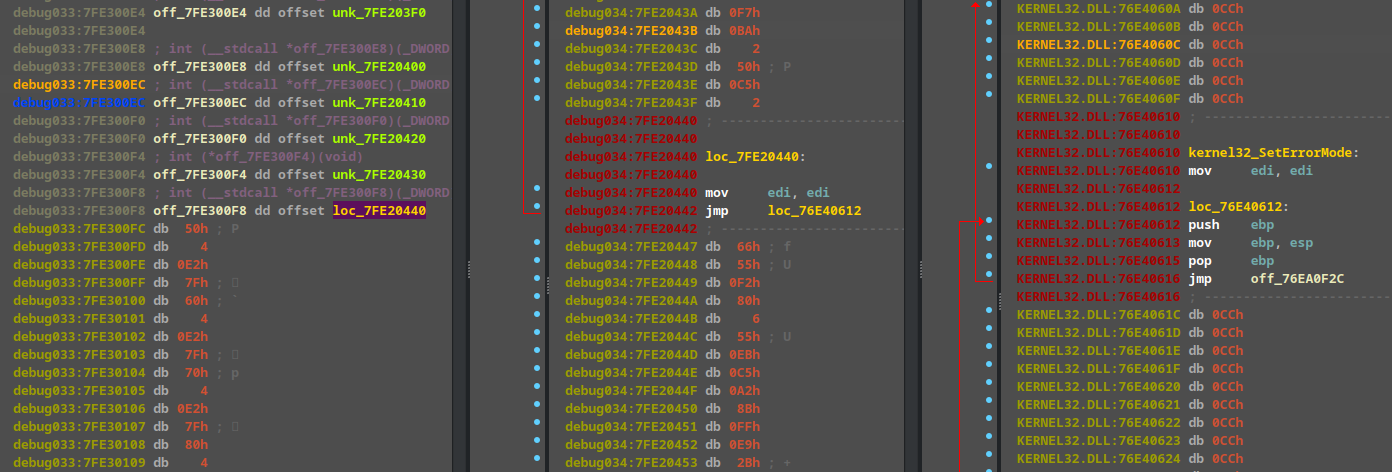
For instance, the call to off_7FE300F8 ultimately resolves to kernel32_SetErrorMode.
off_7FE300F8 points to loc_7FE20440, which executes mov edi, edi; jmp kernel32_SetErrorMode+2.
Leaving the addresses as raw hex values makes the code extremely difficult to read. While one could manually rename these variables (and there are many) or write a script for dynamic analysis, dynamic analysis alone is not very stable for comprehensive code review.
A better approach is to dump the shellcode and load it into IDA. However, this presents two challenges:
- The load address will be different.
- The API references resolved during runtime will be lost.
To solve this, we need to track where the resolved API addresses are stored (their offset relative to the shellcode base) and determine the shellcode’s base address to properly rebase it in IDA.
Rebasing is straightforward. Tracking the APIs requires a bit more effort. There are two key steps to monitor:
- When an API is resolved (e.g.,
ntdll_RtlWalkHeap).
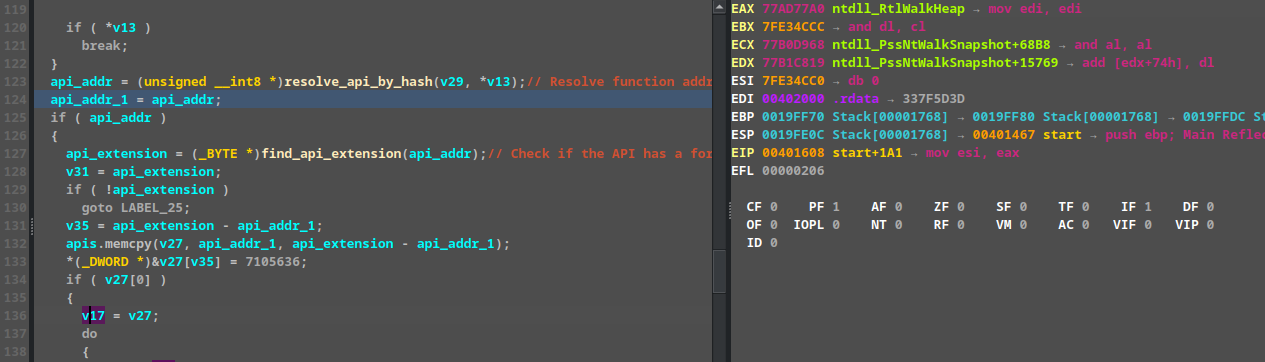
- When the trampoline is created to bypass hooks, and the simulated ‘IAT’ is patched with the trampoline’s address.
We need to record the API name after it’s resolved, and then monitor the ecx register when it patches the address to see where it is being written (ecx - shellcode base = offset).
By writing a debugger script to monitor the API resolution and address patching, we can collect this data. Results snippet:
APIs:
0x77A72EE0 - ntdll_NtQuerySection
0x77A72D10 - ntdll_NtDelayExecution
0x77A3B940 - ntdll_RtlImageNtHeader
0x77ADA960 - ntdll_RtlComputeCrc32
0x77A78F60 - ntdll_memset
0x77A788E0 - ntdll_memcpy
0x77A761B0 - ntdll_isdigit
0x763E9CC0 - ws2_32_WSAStartup
Patched Addresses (Trampolines):
0x7FE3020C - 0x7FE20080
0x7FE30210 - 0x7FE20090
0x7FE30214 - 0x7FE200A0
0x7FE30218 - 0x7FE200B0
0x7FE3021C - 0x7FE200C0
0x7FE30220 - 0x7FE200D0
0x7FE30224 - 0x7FE200E0
0x7FE30238 - 0x7FE200F0
With this mapping established, we can successfully map the patched addresses back to their respective API names.
After dumping the shellcode and loading it into IDA:
As expected, the raw addresses are unrecognized. Now, we rebase the program and run a batch renaming script using the mapped data.
The code becomes significantly more readable.
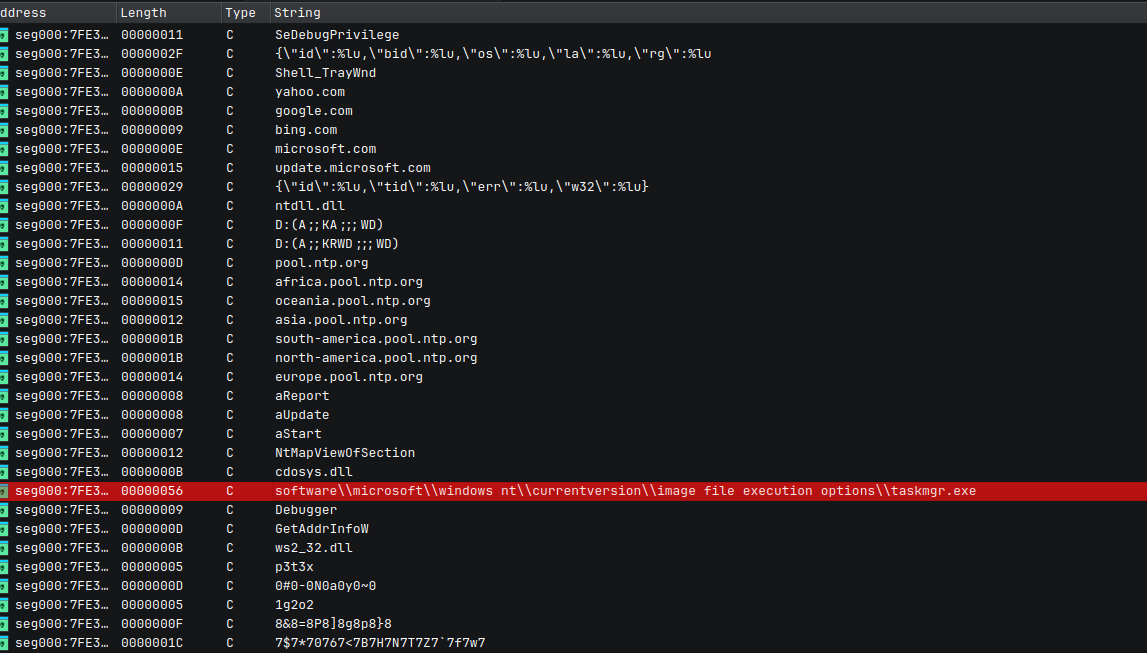
Strings:
Code:
Before:
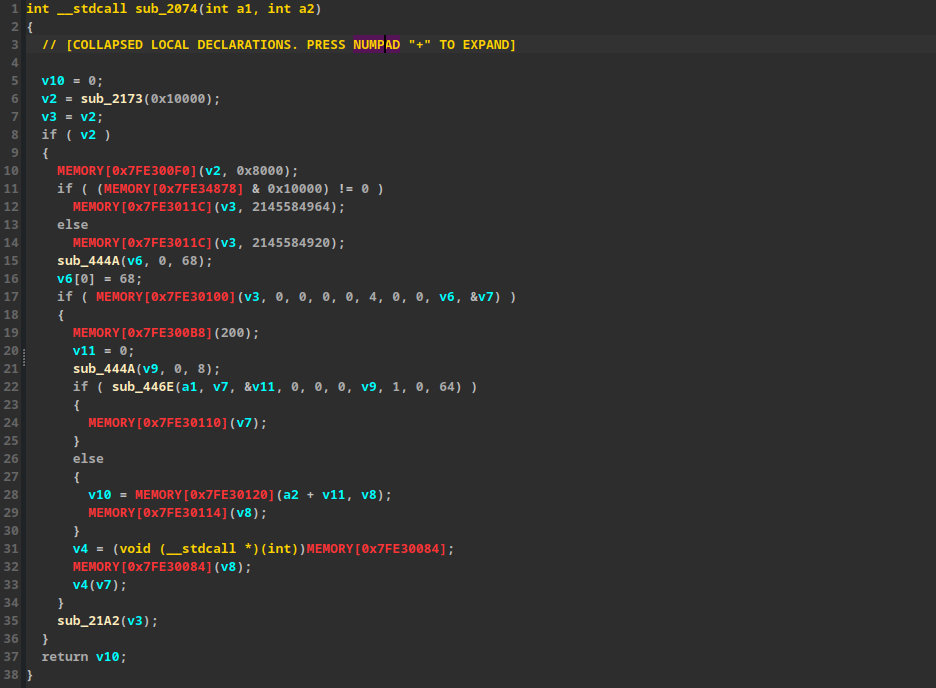
After:
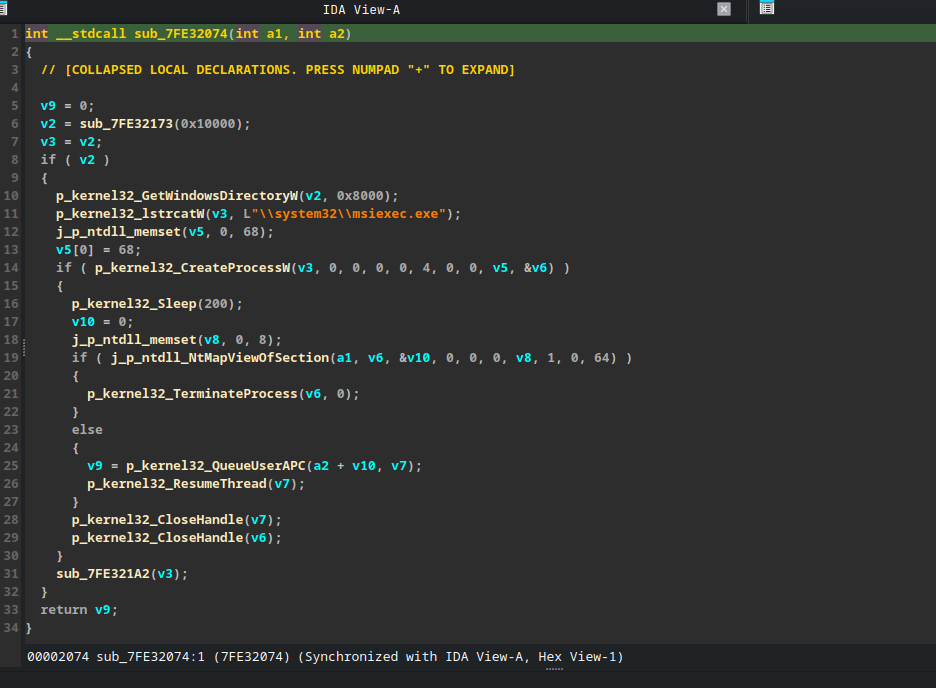
Before:
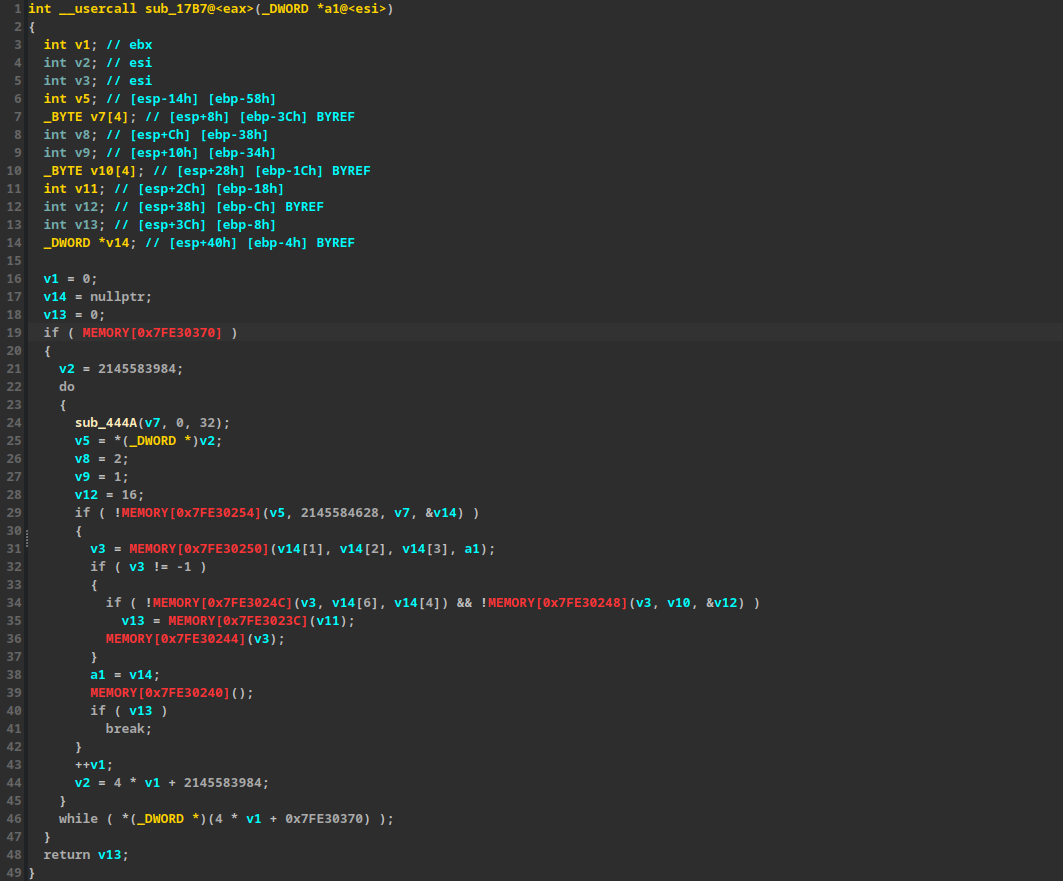
After:
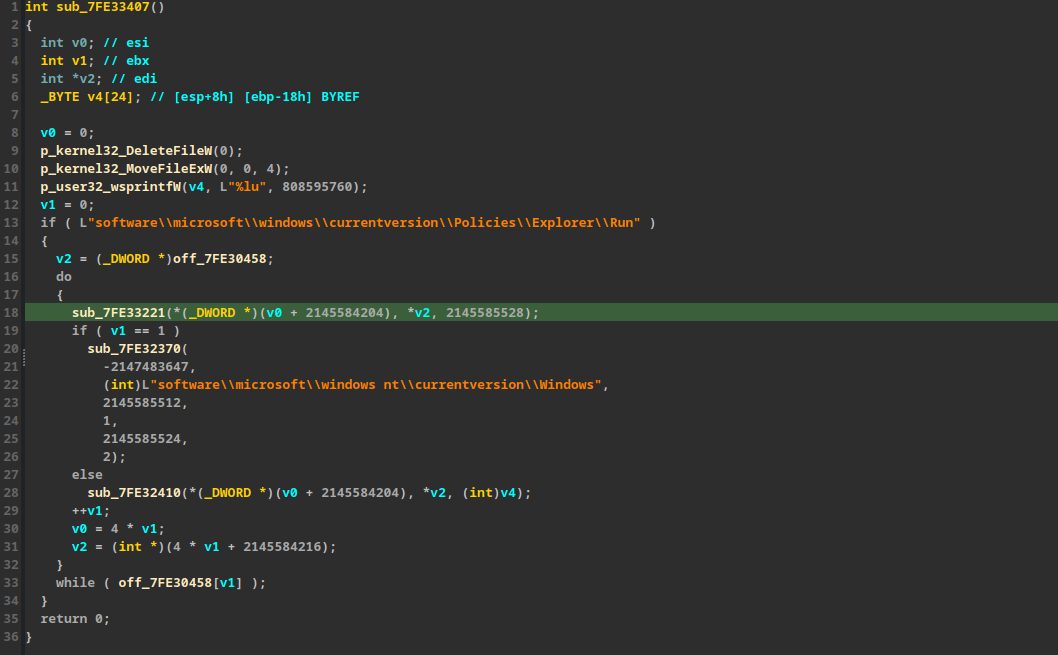
In conclusion, by rebasing the dumped shellcode and programmatically renaming the recovered APIs, the code transforms from an unreadable mess into a clear structure. This allows us to easily comprehend the program’s logic and the APIs it utilizes, ultimately revealing the malware’s true intent.